


Understanding the intricate interplay between market structure, supply and demand zones, and liquidity concepts is crucial for making informed trading decisions. This blog examines a real-time gold price scenario, showcasing how these elements converge to form actionable insights.
Breaking Down the Setup
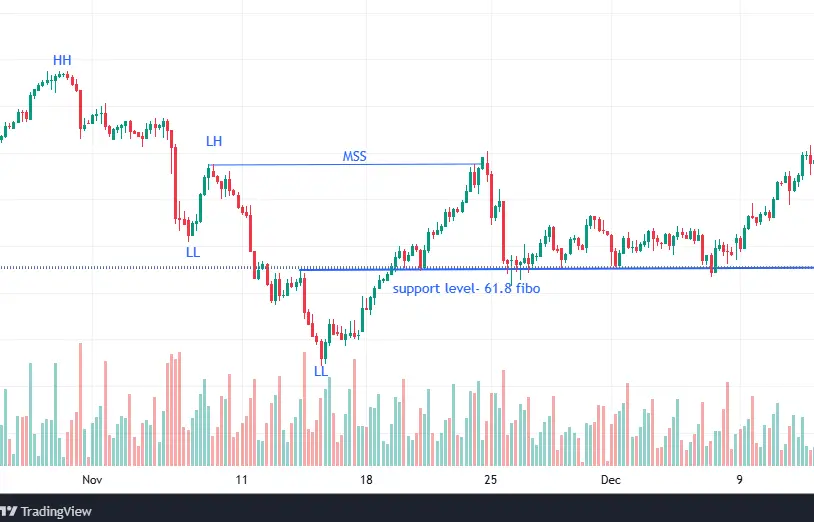
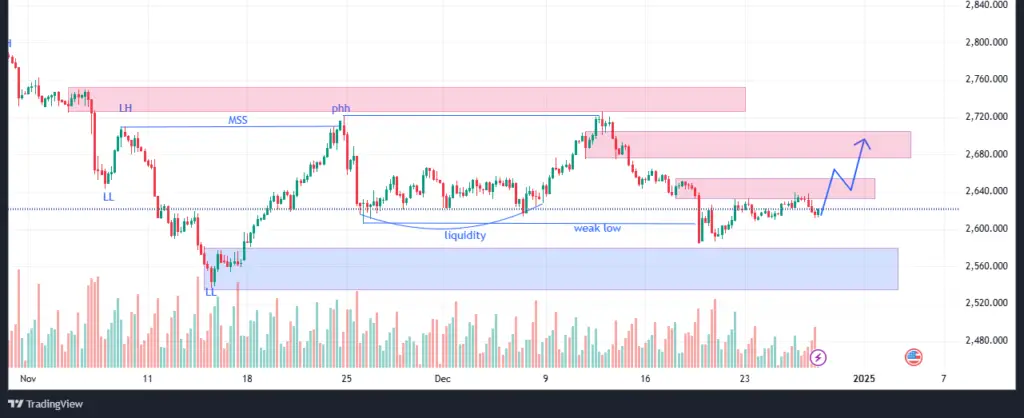
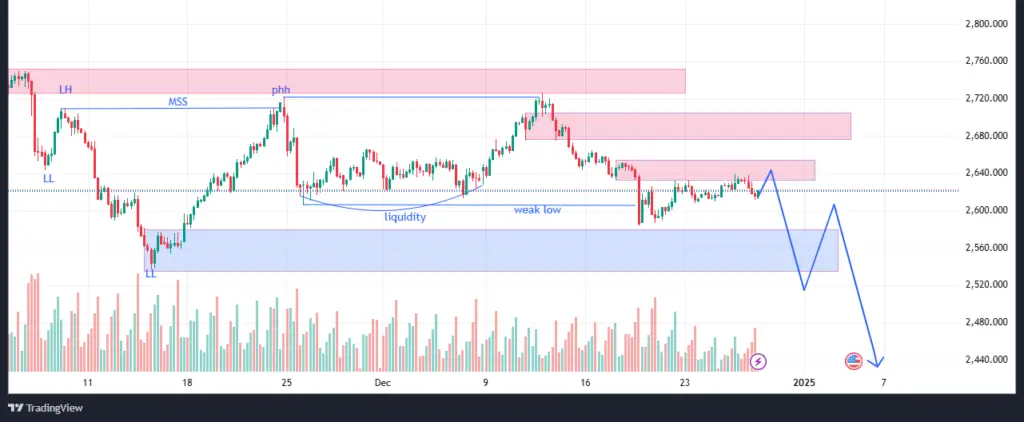
Market Structure Shift (MSS): A market structure shift occurs when the price transitions from one trend to another. In this case, gold prices broke above a lower high (LH), closing beyond it and signaling a potential shift to a bullish trend. This move was followed by a pullback to the 61.8% Fibonacci retracement level, a key area of confluence where price found support. Buyers stepped in, pushing prices higher.
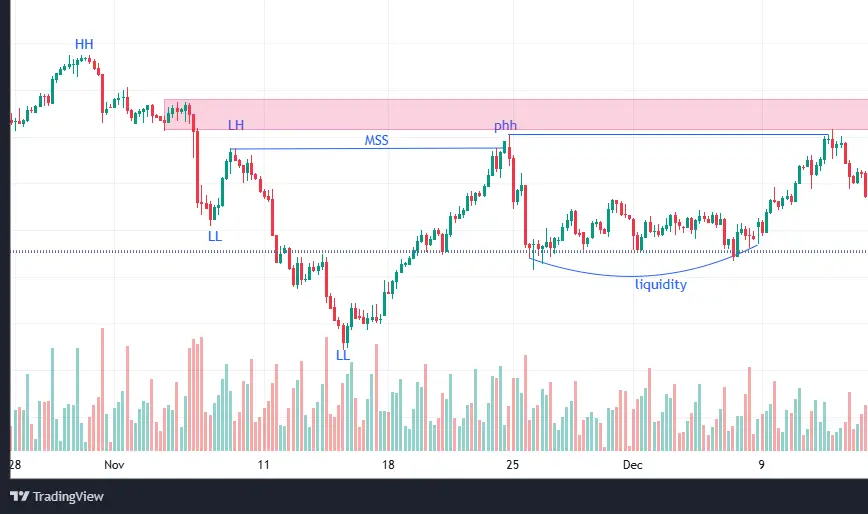
Supply Zone and Rejection: The bullish momentum drove prices toward a previous potential higher high (HH). However, price failed to close above this level due to resistance at a daily timeframe supply zone. This rejection hinted at strong selling pressure, leaving the origin of the bullish move (at the 61.8% Fibonacci level) as a liquidity pool.
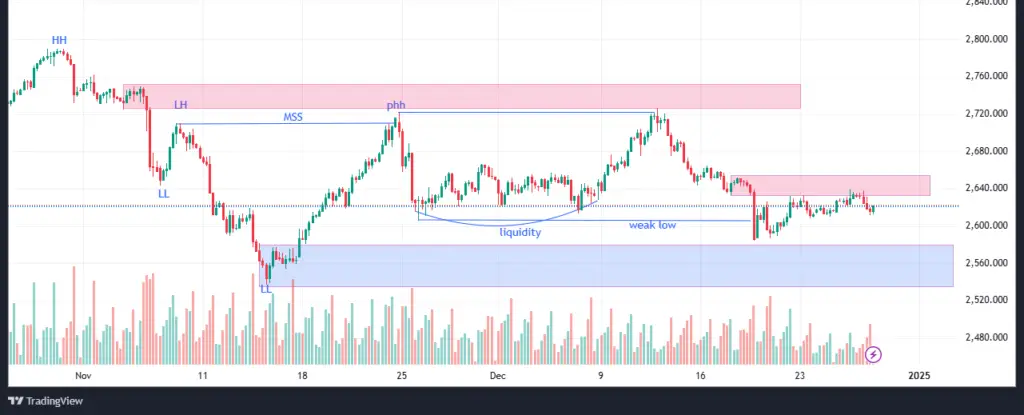
Liquidity Grab and Demand Zone: The price revisited the demand zone, running the liquidity resting below the weak low/support. It then reached an unmitigated demand zone, although not the primary daily demand. Buyers responded, driving prices upward toward a supply zone formed before the liquidity grab.
Critical Observations and Terms:
Current Scenario and Potential Outcomes
Gold prices are testing the supply zone formed before the liquidity grab. How price behaves here will determine the next move:
Concluding Thoughts
This analysis underscores the importance of patience and precision in trading. By observing price reactions at key levels and waiting for confirmation, traders can enhance their decision-making process. Incorporating these concepts into your strategy can improve outcomes and deepen your understanding of market dynamics.
Stay tuned for the accompanying charts to visualize these concepts in action. Let the market guide your decisions with clarity and confidence.


One thought on “XAUUSD H4 Chart Breakdown: What to Watch Out for This Week”