Understanding Candlesticks: The Basics of Price Action Trading
Ladytrading > Blog > Patterns > Understanding Candlesticks: The Basics of Price Action Trading
Introduction
Candlestick charts are the cornerstone of price action trading. For traders who rely on price movement alone, understanding candlesticks is essential. They reveal the story behind price fluctuations, showing traders where the market might be headed. This article will guide you through the basics of candlesticks, their components, and how to interpret them to gain insights into market sentiment.
What are Candlesticks?
Price action chart displaying how candlesticks form in a bullish trend.
Candlesticks are visual representations of price movement within a specific timeframe. They provide crucial information, such as the open, high, low, and close prices, giving traders a snapshot of market behavior during that period. Unlike line charts, which only show closing prices, candlesticks offer a fuller picture, making it easier to identify potential patterns and reversals.
For price action traders, candlesticks are more than just data points; they are tools that help predict future price movements by analyzing past behavior. Each candlestick can signal market sentiment—whether buyers or sellers are in control—making it a valuable element in a trader’s toolkit.
Components of a Candlestick
To effectively read candlesticks, you must understand their components:
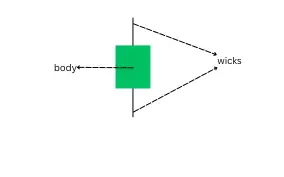
Body: The rectangular area between the open and close prices. It shows the price range for the timeframe. If the close price is higher than the open, the body is typically green (bullish). If the close price is lower, the body is red (bearish).
Wicks (or Shadows): These are the thin lines above and below the body. They represent the high and low points of the price within the timeframe. The upper wick shows how high the price went, while the lower wick shows the lowest point reached.
Color: Candlestick colors are used to distinguish bullish (price closed higher than it opened) from bearish (price closed lower than it opened) movements. Some traders customize these colors, but green for bullish and red for bearish is the most common convention.
Breakdown of a candlestick: body and wicks
Types of Candlesticks and What They Indicate
Now that you know the structure, let’s dive into the different types of candlesticks and what they reveal:
Bullish and Bearish Candles
Bullish Candle: A green candle (or white) indicates that buyers pushed the price higher, with the close price above the open. It’s a sign of upward momentum.
Bearish Candle: A red candle (or black) shows that sellers had control, with the close price below the open. It signals downward pressure.
Types of candlesticks: Bullish versus Bearish candlestick
Doji Candles
A doji forms when the open and close prices are nearly identical, leaving the body very small or almost non-existent. This suggests indecision in the market, as neither buyers nor sellers dominate. Dojis can often hint at a potential reversal, but context is crucial.
Doji candlesticks: Examples of indecision in market trends
Hammer and Inverted Hammer
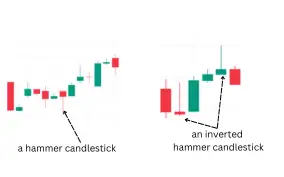
Hammer: A hammer appears at the end of a downtrend, with a small body and a long lower wick. It suggests that buyers are stepping in, potentially signaling a reversal.
Inverted Hammer: Similar to the hammer but appears at the end of a downtrend with the wick above the body. It also indicates a possible reversal if confirmed by the next candle.
Hammer and Inverted Hammer Candlesticks: Signals of potential trend reversals.
Shooting Star and Hanging Man
Shooting Star: Found at the top of an uptrend, it has a small body and a long upper wick. It suggests that sellers are starting to push back, potentially signaling a bearish reversal.
Hanging Man: Appears at the top of an uptrend, similar in shape to the hammer but found in an uptrend. It indicates potential weakness and that a bearish reversal could occur.
Shooting Star and Hanging Man Candlesticks: Indicators of potential trend reversals.
Using Candlestick Patterns to Identify Trends
Candlesticks become even more powerful when analyzed in groups. Multiple candlesticks together form patterns that help traders identify potential market reversals or trend continuations. Here are a few common patterns:
Engulfing Patterns:
A bullish engulfing pattern occurs when a green candle fully engulfs the body of the previous red candle, suggesting a shift from bearish to bullish sentiment.
A bearish engulfing pattern is the opposite, indicating a potential shift from bullish to bearish momentum.
Engulfing Patterns: Bullish and Bearish Signals in Price Action Trading.
Morning Star and Evening Star:
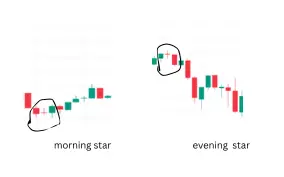
Morning Star: A three-candlestick pattern that starts with a bearish candle, followed by a small-bodied candle (indecision), and ends with a strong bullish candle. It indicates a potential bullish reversal.
Evening Star: The reverse of the morning star, signaling a bearish reversal.
Understanding these patterns and recognizing their formations on charts allows traders to anticipate market shifts and position themselves accordingly.
Morning Star and Evening Star Patterns: Signals of Market Reversals.
Practical Tips for Analyzing Candlesticks
Start with Single Candlesticks: Focus on understanding the basics of individual candlesticks before diving into complex patterns. Look for hammers, dojis, and engulfing candles.
Practice Spotting Patterns: Once you’re comfortable, start identifying patterns like double tops, double bottoms, and morning/evening stars. Practice spotting them on historical charts to gain confidence.
Consider the Context: A candlestick’s meaning changes depending on where it forms. For instance, a hammer at the end of a downtrend is significant, but in the middle of a trend, it might not mean much. Always look at the bigger picture.
Conclusion
Candlesticks are fundamental to price action trading, offering real-time insights into market sentiment and potential reversals. By understanding their structure and meaning, traders can make more informed decisions without relying on additional indicators. Practice reading and interpreting candlestick charts to sharpen your skills and build confidence as a price action trader.
In our next article, we’ll dive into the importance of support and resistance levels and how to use them effectively in price action trading. Stay tuned!