
In this analysis, we dive deep into the key levels, trends, and scenarios shaping Safaricom Ltd. stock’s trajectory. Will the bulls reclaim control, or are the bears gearing up for a dominant move? By breaking down the chart’s behavior, we’ll uncover the crucial clues that can help traders navigate the market’s next move with precision.
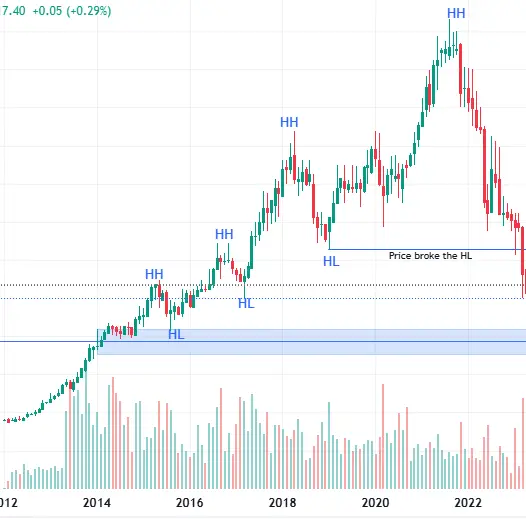
Looking at the monthly chart for Safaricom Ltd., we can observe that the price was previously in a bullish trend. This trend was characterized by the formation of higher highs (HHs) and higher lows (HLs), a pattern that indicates sustained upward momentum. However, the trend was disrupted when the price broke below the most recent HL.
While the price did break the HL, it initially failed to close below it, forming only a wick at that level. This wick suggested a potential liquidity grab—a move where price temporarily dips to trigger stop-loss orders or capture pending buy orders before reversing direction. At this point, the market could still have resumed its bullish trajectory, but confirmation was needed to determine if buyers were still in control.
It’s important to note that a bearish trend is defined by the formation of lower lows (LLs) and lower highs (LHs). On the monthly chart, a clear bearish trend has not yet been established. Instead, we see the price breaking below a HL and moving lower. As the price creates and respects supply zones, these zones will remain significant until the bearish objective is met.
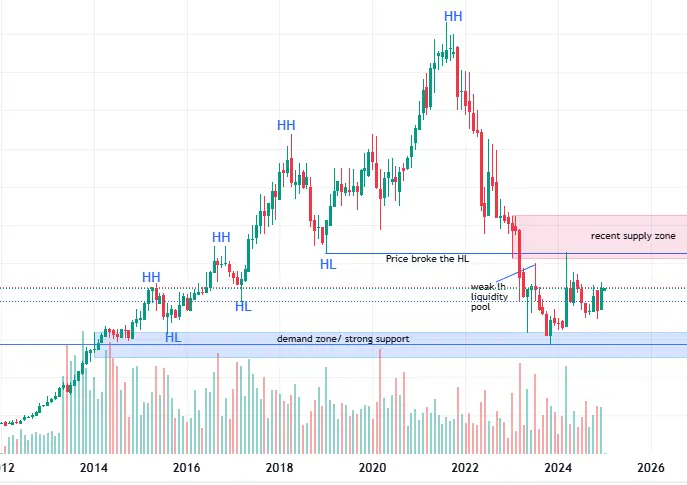
Eventually, the price reached a strong support level that had previously held and caused upward movement. Buyers attempted to push prices higher but failed to reach the supply zone. Instead, the price reversed, breaking structure and creating a lower high (LH). This LH was weak and served as a liquidity pool.
The price retested the strong support level, where buyers re-entered and pushed prices up. This upward movement grabbed liquidity at the weak LH and extended to the supply zone, which coincided with the resistance level at the broken HL of the previous bullish leg of structure (LOS). At this supply zone, the price faced strong rejection as sellers regained control and pushed prices lower to the origin demand zone of the bullish LOS.
At present, the price is sitting at the origin demand zone. This is a critical area that will determine the next market direction. Here are the two potential scenarios:
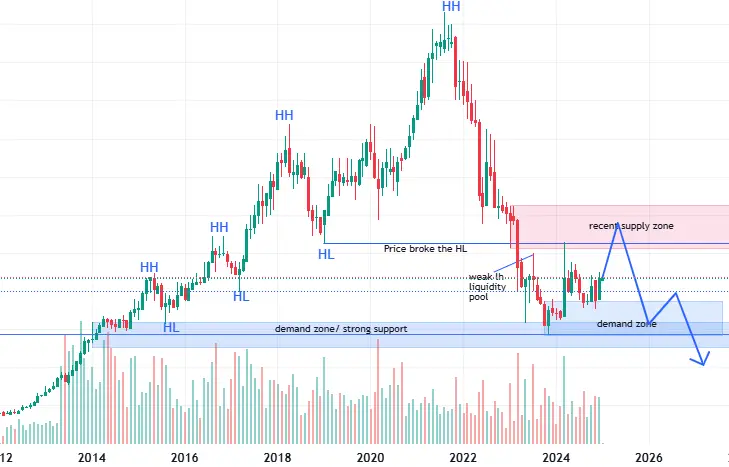
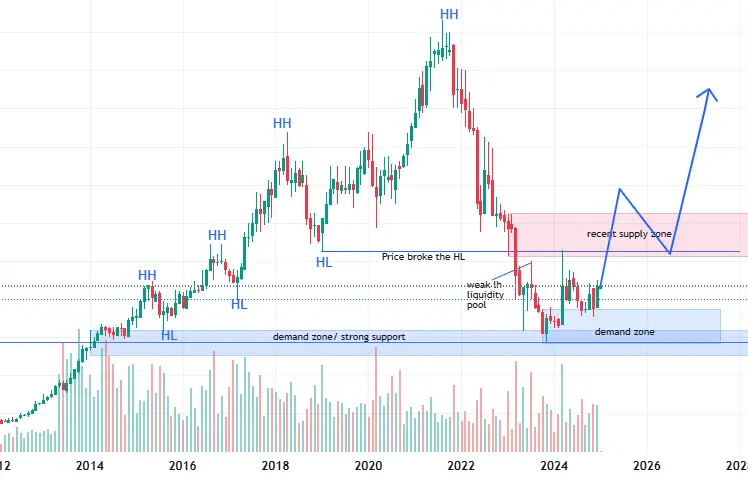
The current market position on the Safaricom Ltd. chart is pivotal. Traders should wait for clear confirmation before taking positions, whether it’s a break below the demand zone for bearish continuation or a break above the supply zone for bullish reversal. Patience and careful observation will be key to navigating this setup effectively.
Glossary: